


Imagine a photograph so enormous that displaying it pixel by pixel on an average smartphone would take more than a million years. It sounds like science fiction, but it’s real: scientists have released the largest 2D map of the universe ever created.
- What Exactly Is the DESI Legacy Imaging Survey?
- How Big Is 5.6 Trillion Pixels, Really?
- What Kind of Objects Does the Map Show?
- The Instruments Behind the Discovery
- Why This Map Matters for Dark Energy and Dark Matter
- What Happens If Dark Energy Is Weakening?
- Who Can Use This Map, and How
- Data and Trends: The Scale of the Project at a Glance
- Looking Ahead: What Comes Next
- Conclusion: What This Map Teaches Us About Our Place in the Cosmos
Built by the Dark Energy Spectroscopic Instrument (DESI) Legacy Imaging Surveys team, the map contains 5.6 trillion pixels and captures nearly 4 billion cosmic objects, mostly stars and galaxies. It covers roughly three-quarters of the sky and represents 13 years of observation, processing, and careful data analysis.
But this isn’t simply a spectacular image for astronomy fans. It’s a working scientific resource that researchers, students, and curious members of the public can explore for free. In this article, we’ll look at how the map was created, and what it contains. And why it matters to some of the biggest unanswered questions in physics.
What Exactly Is the DESI Legacy Imaging Survey?
The DESI Legacy Imaging Surveys weren’t created by a single telescope or research team. They combine three separate ground-based sky surveys into one enormous dataset.
The three surveys are the Dark Energy Camera Legacy Survey (DECaLS), the Mayall z-band Legacy Survey (MzLS), and the Beijing-Arizona Sky Survey (BASS). Together, they used powerful telescopes in the United States and Chile to photograph the sky repeatedly in different wavelengths of light over more than a decade.
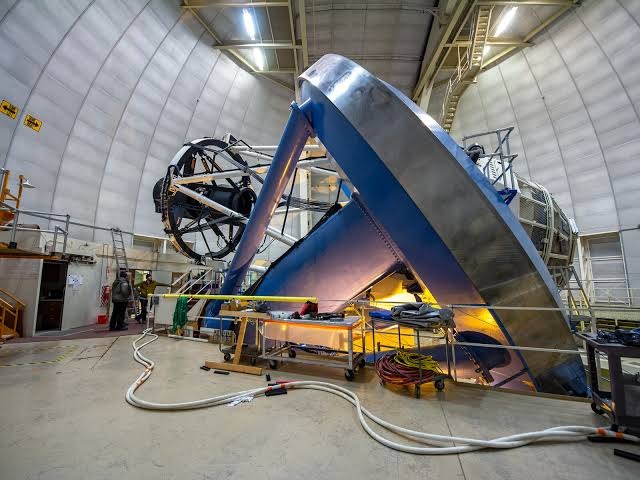
Across 13 years, the surveys produced 263,407 telescope exposures. NASA’s WISE satellite data was also incorporated, and the resulting data was processed at the National Energy Research Scientific Computing Center (NERSC). More than a quarter of a million individual exposures were combined into one seamless, navigable view of the cosmos.
The scale of that effort is difficult to grasp. Most people will never work on a project that takes more than a decade and involves hundreds of thousands of individual observations. Yet that’s what it took to create this map.
How Big Is 5.6 Trillion Pixels, Really?
Numbers like “5.6 trillion” tend to lose their meaning once they get large enough. So let’s ground it in something familiar.
A modern smartphone photo has around 12 million pixels. To match the size of this universe map, you would need to take almost half a million smartphone photos and arrange them into a single continuous image without a single gap or seam.
Here is how the map’s scale compares to other well-known imaging efforts:
| Project | Pixel Count | Coverage | Time to Build |
| DESI Legacy Imaging Surveys | 5.6 trillion | ~75% of the sky | 13 years |
| Standard DSLR camera photo | ~24 million | Single frame | Instant |
| Sloan Digital Sky Survey (SDSS) | ~1.2 trillion | ~35% of the sky | ~8 years |
| Modern smartphone panorama | ~50 million | Wide-angle scene | Seconds |
This comparison shows just how far observational astronomy has advanced. Earlier all-sky surveys like SDSS were groundbreaking in their time, but the DESI map covers more sky, at finer detail, with nearly triple the pixel density.
Read More : NASA’s James Webb Telescope’s New Astronomy Image
What Kind of Objects Does the Map Show?
The nearly 4 billion objects captured in this map are not random specks of light. Each one has been recorded with its position, brightness, and shape, turning the image into a searchable scientific catalog rather than just a photograph.
The map contains nearly four billion celestial objects, including stars, galaxies, black holes, and asteroids. Among the highlighted discoveries visible in the data is a well-known nearby galaxy that gives scientists a sense of scale.
One striking example is Messier 96, a majestic spiral galaxy nestled in the constellation Leo approximately 35 million light-years from Earth. Even at that mind-bending distance, the map resolves it in impressive detail, along with billions of fainter, more distant objects surrounding it.
Some of the object types you can expect to find while browsing the map include:
- Spiral and elliptical galaxies, some resembling our own Milky Way
- Individual stars within our galaxy, at varying brightness levels
- Quasars, the blazing cores of distant active galaxies
- Asteroids captured mid-motion across the field of view
- Gravitational lens candidates, where massive objects bend the light of galaxies behind them
The Instruments Behind the Discovery
Building a map this large required serious hardware. The core imaging came from telescopes stationed at two major observatories, chosen specifically for their clear skies and high-altitude locations.
The Dark Energy Camera Legacy Survey (DECaLS) was conducted by the 570-megapixel Department of Energy-fabricated Dark Energy Camera (DECam), mounted on the U.S. National Science Foundation Victor M. Blanco 4-meter Telescope at NSF Cerro Tololo Inter-American Observatory (CTIO) in Chile. A second survey, the Mayall z-band Legacy Survey, used a similar large telescope located at Kitt Peak National Observatory in Arizona.
These instruments observed the sky in visible and near-infrared wavelengths. Near-infrared observation matters because it lets astronomers see through cosmic dust that would otherwise block the view of distant galaxies in regular visible light.
The observing campaign was also deliberately strategic in where it looked. The result covers roughly 75% of the sky in visible and near-infrared light, deliberately focused on regions where Milky Way dust doesn’t block the view. This is why the map does not cover the entire sky. Areas thick with our own galaxy’s dust were left out to keep the data clean and scientifically useful.
Why This Map Matters for Dark Energy and Dark Matter
This project was never just about taking a pretty picture. Its real purpose is to act as a targeting map for one of the most ambitious science missions in modern astronomy.
The 2D survey’s targeting catalog told DESI’s spectrograph which of the billions of objects in the sky it should measure next. The spectrograph then measured the redshifts, or distances, of tens of millions of galaxies, producing the 3D map of cosmic structure that revealed the dark energy signal.
In simple terms, this 2D map tells scientists where to look. The DESI spectrograph then tells them how far away each object is, by analyzing how its light has stretched during its journey across the universe. Combine the two, and you get a full 3D model of how galaxies are arranged in space.
This work directly feeds into research on two of the biggest open questions in physics. Researchers can use it to investigate dark matter, the invisible material that accounts for most of the mass in the universe, and dark energy, which is driving the universe’s accelerating expansion.
Recent findings connected to this same DESI project have already stirred debate among physicists. The dark energy findings that DESI has generated since 2024, hints that dark energy may be weakening over cosmic time, could potentially require the revision of the Lambda-CDM standard model of cosmology that has guided physics for decades.
Read More : Cosmic Microwave Background Radiation: Discovery & Significance
What Happens If Dark Energy Is Weakening?
This is where the science turns genuinely fascinating, and a little unsettling. If dark energy really is losing strength over time, the future of the universe itself could look very different from what scientists have long assumed.
If that field is weakening, the balance between dark energy’s outward push and gravity’s inward pull would shift over cosmic time. Some possibilities researchers are now taking seriously include:
- The universe could slow its expansion and eventually begin collapsing inward, a scenario nicknamed the Big Crunch
- The field could stabilize at a new, lower value and continue driving gentler expansion
- Current data remains inconclusive, meaning more precise measurements are still needed
No current dataset is precise enough to distinguish between these possibilities. That uncertainty is exactly why bigger, sharper maps like this one matter so much. Every additional galaxy chart brings scientists closer to an answer.
Who Can Use This Map, and How
One of the most refreshing aspects of this release is its accessibility. The data is available to everyone and can be viewed publicly through the Legacy Survey Sky Viewer. You do not need a research grant or a university login to explore it.
Astronomers and citizen scientists can use the map to explore space or combine it with their own observations to learn more about the universe. For amateur astronomy enthusiasts, this is a genuine chance to browse the same raw data that professional researchers rely on.
Practical use cases already underway include:
- Hunting for gravitational lenses, rare alignments where a massive galaxy bends and magnifies light from an object behind it
- Tracking supernovae, short-lived stellar explosions that appear and fade within weeks
- Training AI models to automatically classify galaxies and detect rare cosmic events
- Preparing for future telescopes, since this dataset is already being used to calibrate incoming instruments
This dataset has guided DESI’s nightly observing runs since June 2026, will calibrate the Vera C. Rubin Observatory’s incoming sky data, and has been designated as one of the first astrophysics datasets to train AI classifiers under the U.S. Department of Energy’s Genesis Mission.
Data and Trends: The Scale of the Project at a Glance
To appreciate how this project came together, it helps to see the key numbers side by side.
| Metric | Figure | Significance |
| Total pixels | 5.6 trillion | Largest 2D astronomical image ever compiled |
| Cosmic objects catalogued | ~4 billion | Mostly stars and galaxies, some quasars and asteroids |
| Telescope exposures used | 263,407 | Combined from three separate sky surveys |
| Sky coverage | ~75% | Focused on regions with minimal Milky Way dust |
| Years of observation | 13 | Continuous data collection and refinement |
| Observing nights | 2,285 | Spread across multiple observatories |
This cosmic portrait was compiled by combining 263,407 individual exposures gathered across 2,285 nights from three major sky surveys. That level of sustained, coordinated effort across multiple observatories and research institutions is rare in any scientific field, let alone one that depends so heavily on clear night skies and precise timing.
The scientists behind the project are candid about how central this map has become to modern astronomy. “It’s part of the fabric of astronomy research now,” said David Schlegel, co-lead of the Legacy Surveys and a scientist at the U.S. Department of Energy’s Lawrence Berkeley National Laboratory.
Looking Ahead: What Comes Next
This map is not the end point. It is groundwork for even more ambitious projects already coming online. Two major telescopes, the Vera C. Rubin Observatory and the Nancy Grace Roman Space Telescope, are expected to lean heavily on this dataset as they begin their own sky surveys.
Researchers plan to use it to hunt rare gravitational lenses and supernovae, study how galaxies evolve, and train AI tools for the Vera C. Rubin Observatory and the Nancy Grace Roman Space Telescope as those facilities come online.
Perhaps the most meaningful part of this entire project is the philosophy behind releasing it publicly. As one of the survey’s co-leads put it in a widely shared statement, the skies belong to everyone, not just professional astronomers with institutional access.
Conclusion: What This Map Teaches Us About Our Place in the Cosmos
The largest 2D map of the universe is more than an engineering achievement. It is a humbling reminder of how vast creation truly is, with billions of galaxies each containing billions of stars, all captured in a single dataset we can now explore from a browser.
Staring into a map built from 5.6 trillion pixels naturally raises deeper questions. Who set the laws that govern galaxies, gravity, and the slow expansion of everything we see? Science can measure and map, but the search for meaning behind existence often leads seekers beyond data and telescopes.
For those drawn to explore these deeper questions of purpose and the origin of the universe itself, the books “Gyan Ganga“ and “Way of Living“ by Saint Rampal Ji Maharaj offer thoughtful spiritual insight. They invite quiet reflection on the Creator behind the creation, a perspective worth exploring alongside our scientific wonder.